Loader Throughput:
knonik vs lance vs LeRobot
A GPU can only train as fast as the data reaches it. On robot datasets that data is video, and getting it into a training step means finding the right frames, decoding them, and moving them onto the card, thousands of times a second. This benchmark measures how many frames each storage format and loader can actually deliver, on three real datasets, and what each one costs in memory and disk space along the way.
Reproduce this benchmarkgithub.com/knonik/benchmark_throughput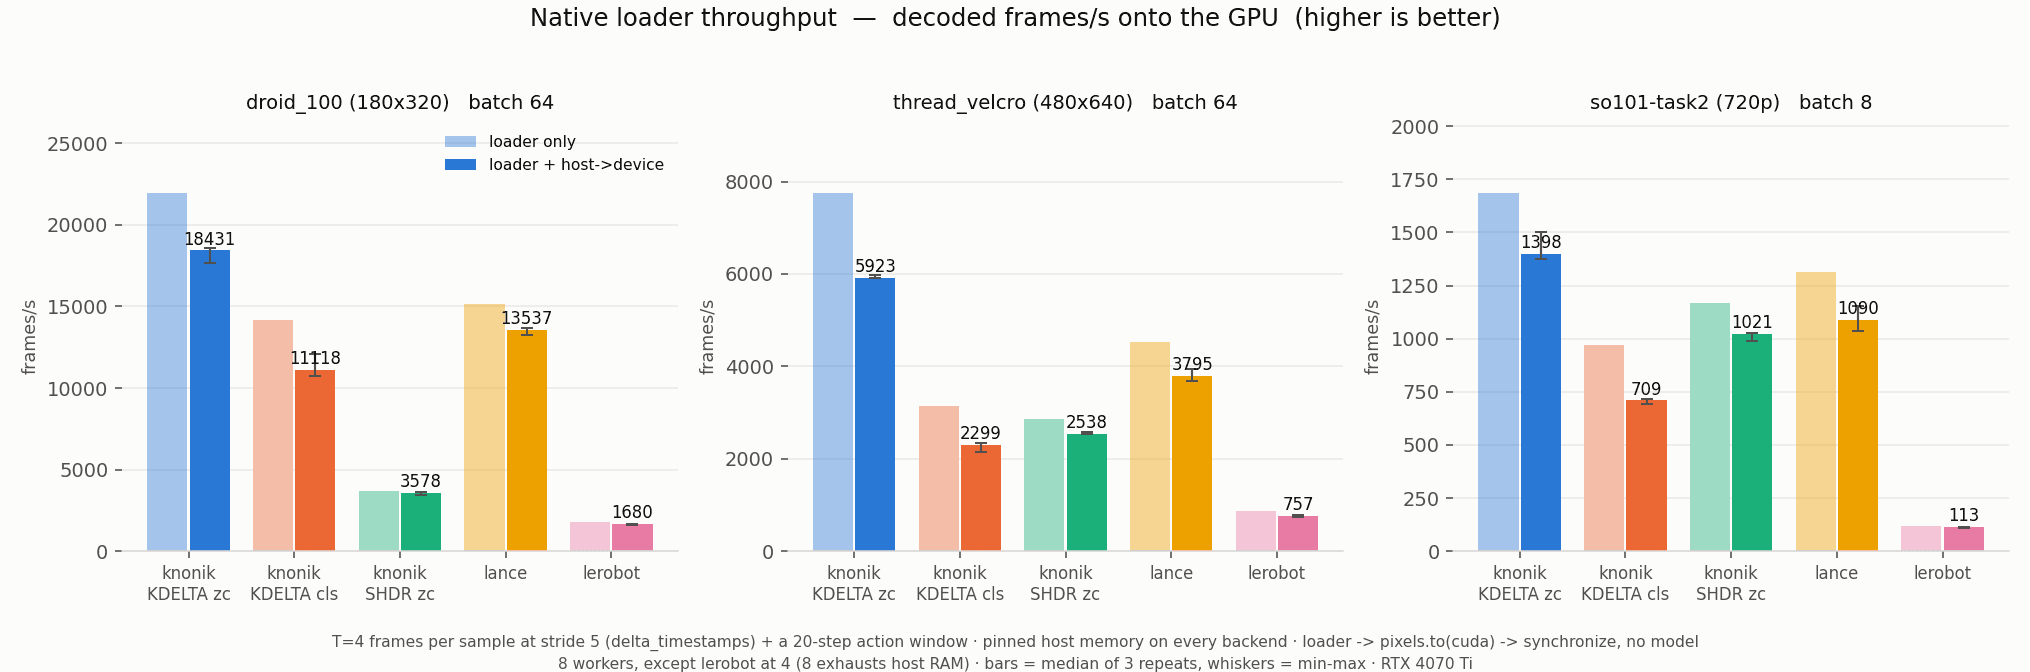
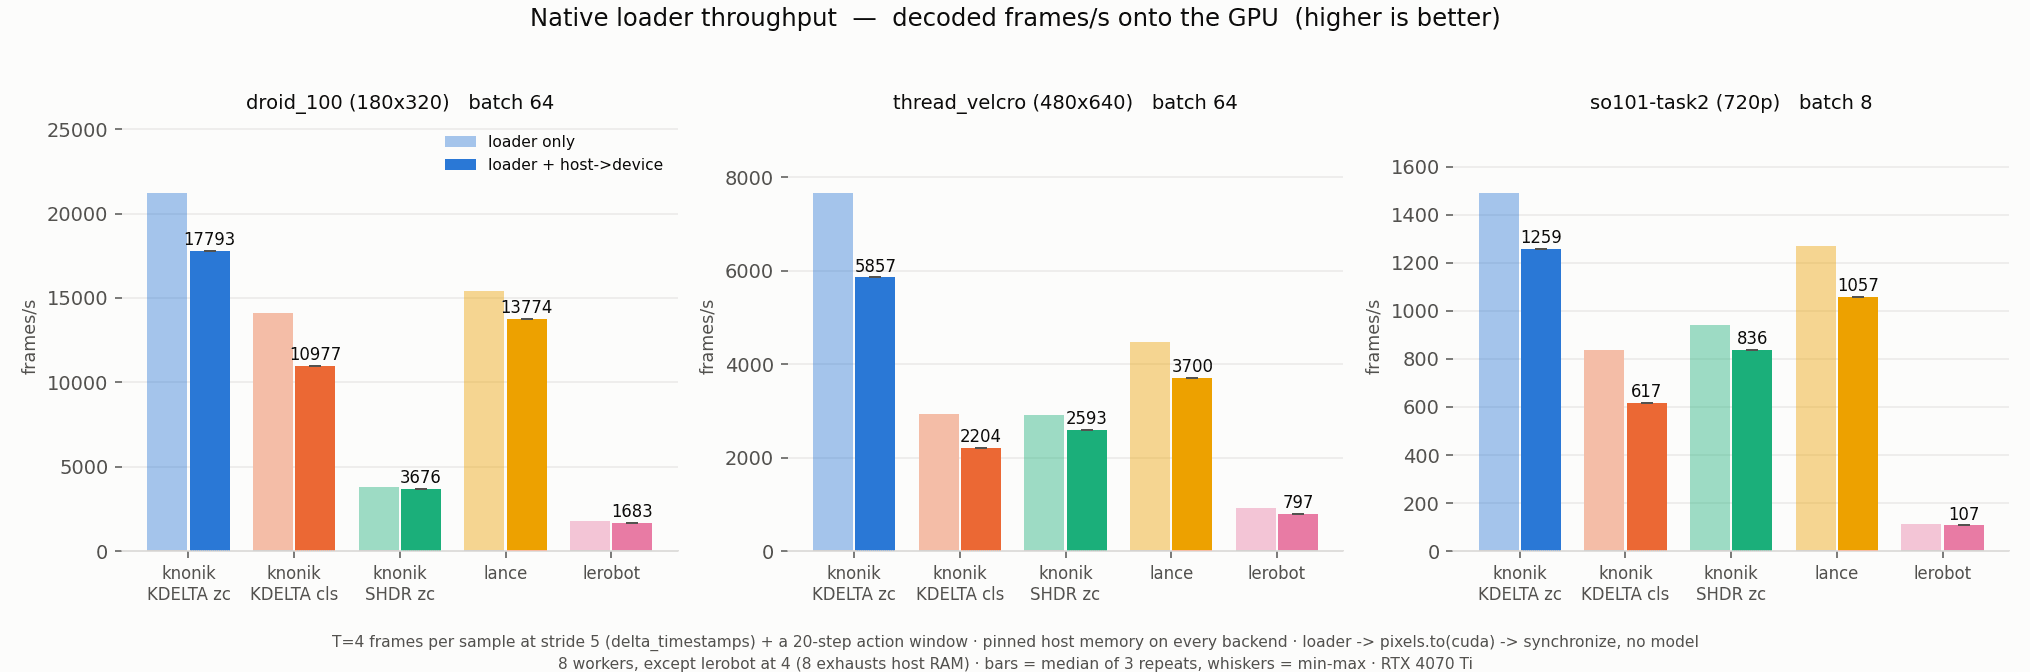
The headline result. Pale bar: the loader alone. Saturated bar: the loader plus the copy onto the GPU, which is what a training step actually waits for. Whiskers show the fastest and slowest of the three repeats. One panel per dataset, because the batch size differs between them.
What the Benchmark Represents
Training a robot policy means repeatedly asking for a short clip: a handful of frames spaced a few steps apart, together with the robot state and the actions that follow. Those clips are drawn in shuffled order from across the whole dataset, so the loader is doing random access into compressed video, over and over, for the entire run. If it cannot keep up, the GPU sits idle and the extra hardware buys nothing.
Most storage benchmarks do not measure this. Bytes per second off disk does not capture it, because the formats differ in how much work they must do after the read. Rows per second does not capture it either, because a row is a different amount of pixels in each format. What matters is decoded, correctly windowed frames per second, in GPU memory.
So the measured quantity here is the training loop with the model taken out: fetch a batch, move the pixels to the GPU, wait for them to land, repeat. No forward pass, no backward pass, no optimizer. The goal is the ceiling the data path imposes on any model you might put on top of it.
Each loader is driven through its own public API: knonik through ShardedDataLoader, lance through lance.dataset(...).take() inside a torch DataLoader, LeRobot through LeRobotDataset(delta_timestamps=…). There is no shared abstraction layer, so what is being measured is a property of the loaders rather than of the harness.
The Three Datasets
Chosen to span an order of magnitude in frame size, because the ranking of a data path is not scale-invariant: what wins at 180×320 is not automatically what wins at 720p.
| Dataset | Frames | Cameras | Resolution | FPS | Batch | Source | Source media |
|---|---|---|---|---|---|---|---|
| droid_100 (180×320) | 32,212 | 3 stored / 1 read | 180 × 320 | 15 | 64 | DROID | stills |
| thread_velcro (480×640) | 34,300 | 1 | 480 × 640 | 50 | 64 | LeRobot aloha_static_thread_velcro | stills |
| so101-task2 (720p) | 33,801 | 1 | 720 × 1280 | 30 | 8 | LeRobot so101-task2-720p | HEVC video |
droid_100 stores three cameras but the benchmark reads one: reading three would triple the pixels per sample and make the dataset incomparable with the single-camera ones. so101-task2 runs at batch 8 rather than 64.
The Five Configurations
Three knonik configurations, two external baselines. The two knonik storage profiles are a real trade, and the third knonik row exists purely as an internal control.
ShardedDataLoader, decode_mode=random_access, zero-copy on
The throughput-oriented storage profile, read in zero-copy mode. Bigger on disk than SHDR, still smaller than lance, and the fastest configuration measured here.
ShardedDataLoader, decode_mode=random_access, zero-copy off
The same data through the same loader with zero-copy switched off. It is here so the effect of the zero-copy path can be read separately from the effect of the storage profile.
ShardedDataLoader, decode_mode=random_access, zero-copy on
The storage-oriented profile: gop-5 video, far smaller on disk. A random read has to touch a whole group of pictures, and that is the price it pays for the size.
lance.dataset(...).take() inside a torch DataLoader, imagecodecs JPEG decode in the worker
Windowing is done over the table's own (episode, step) index; column roles are resolved from the table schema, so a differently-named table still runs.
LeRobotDataset(delta_timestamps=…) inside a torch DataLoader
Its own public API with its own delta_timestamps, exactly as a LeRobot training script would use it. It returns float32, which is 4× the pixel bytes of every other backend.
The Measurement Contract
Identical for every backend. Anything a backend cannot honour is disclosed rather than quietly relaxed.
Two modes, and why both exist
pure mode runs three repeats with no instrumentation beyond the timer. It is where the headline throughput numbers come from, and the published value is the middle of the three, with the difference between the fastest and slowest printed beside it. The middle result rather than the average, because a single slow repeat, a background process or a thermal blip, should not move a published number.
metrics mode runs once with a sampler walking /proc twice a second for the parent process and every descendant, recording resident memory and /dev/shm. That sampler costs a few percent of throughput, which is why memory and speed are never read off the same run.
Handicaps, Stated Up Front
lerobot runs at 4 workers, not 8
LeRobot returns float32, so one batch carries 4× the pixel bytes of every other backend: 943.7 MB against 235.9 MB on thread_velcro. With pinned memory on, in-flight batches cannot be swapped out, and at 8 workers it repeatedly exhausted a 62 GB host. Fewer workers is the only knob that bounds it without changing the batch and window contract. It is a handicap in lerobot's favour, and it is disclosed on every figure.
Throughput: decoded frames/s onto the GPU
End to end: decoded, copied to the device, and confirmed to have arrived. Middle of 3 repeats, pure mode. Higher is better.
frames/s, end to end (loader plus the copy onto the GPU)
| Backend | droid_100 (180×320) f/s | thread_velcro (480×640) f/s | so101-task2 (720p) f/s |
|---|---|---|---|
| knonik KDELTA zc | 18,431 | 5,923 | 1,398 |
| knonik KDELTA cls | 11,118 | 2,299 | 709 |
| knonik SHDR zc | 3,578 | 2,538 | 1,021 |
| lance | 13,537 | 3,795 | 1,090 |
| lerobot | 1,680 | 757 | 113 |
frames/s, loader only (before the copy onto the GPU)
| Backend | droid_100 (180×320) f/s | thread_velcro (480×640) f/s | so101-task2 (720p) f/s |
|---|---|---|---|
| knonik KDELTA zc | 21,966 | 7,756 | 1,686 |
| knonik KDELTA cls | 14,187 | 3,152 | 970 |
| knonik SHDR zc | 3,706 | 2,850 | 1,169 |
| lance | 15,133 | 4,526 | 1,313 |
| lerobot | 1,767 | 870 | 120 |
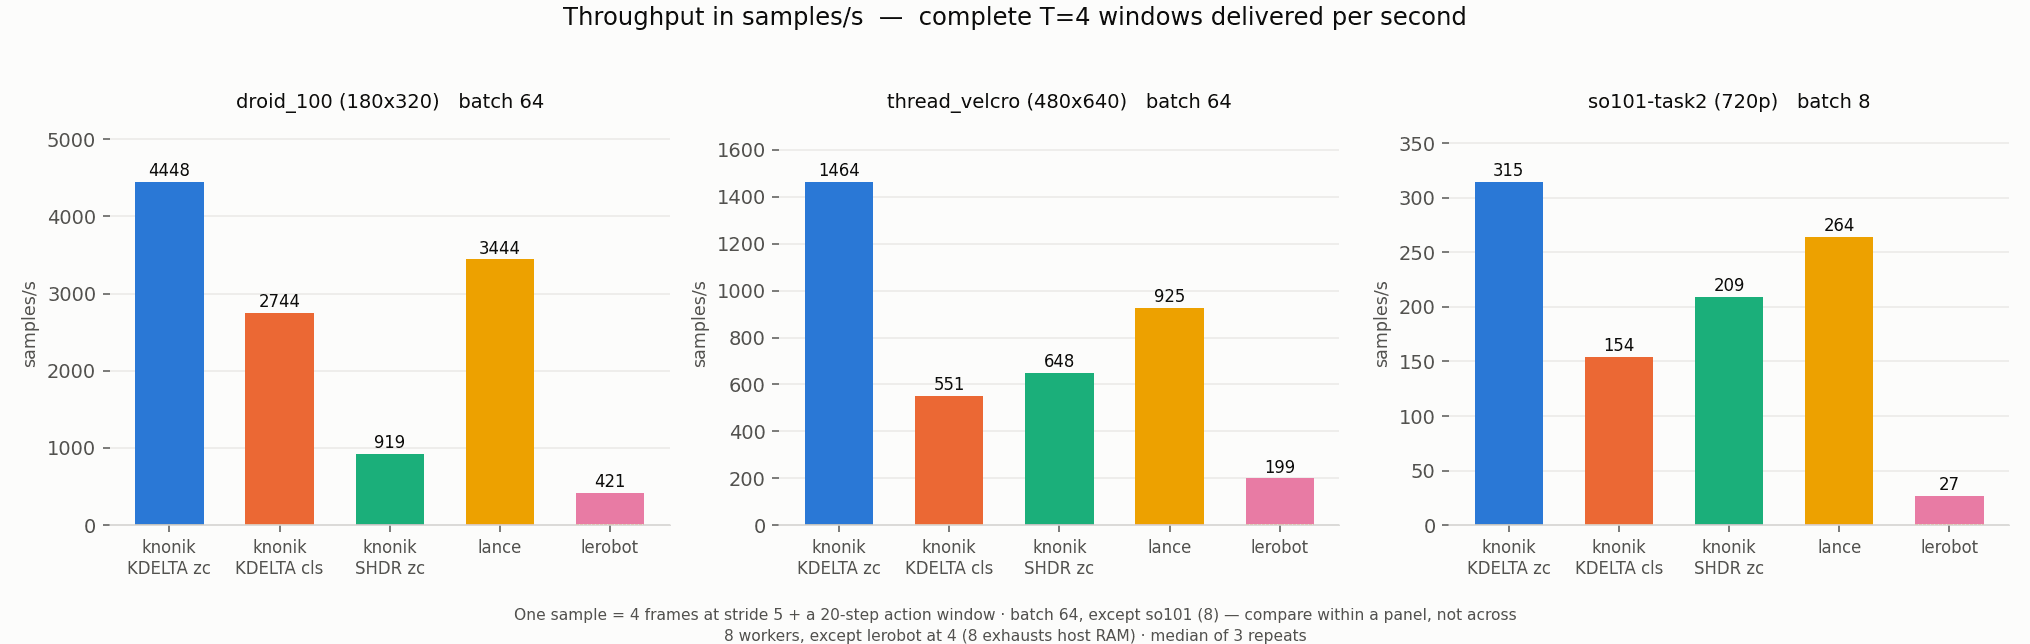
samples/s: complete T=4 windows, the unit a training step consumes
Batch 64, except so101-task2 at 8.
| Backend | droid_100 (180×320) samp/s | thread_velcro (480×640) samp/s | so101-task2 (720p) samp/s |
|---|---|---|---|
| knonik KDELTA zc | 4,608 | 1,481 | 349 |
| knonik KDELTA cls | 2,779 | 575 | 177 |
| knonik SHDR zc | 895 | 634 | 255 |
| lance | 3,384 | 949 | 272 |
| lerobot | 420 | 189 | 28 |
knonik KDELTA (zero-copy) leads on frames/s and samples/s on all three datasets. The one place a knonik row loses is SHDR on droid_100. That is the storage profile paying for its 10.2× smaller footprint at the smallest frame size in the set, and it is discussed below rather than hidden.
The rest of the plots produced by bench/native_plots.py, in the order they are generated.
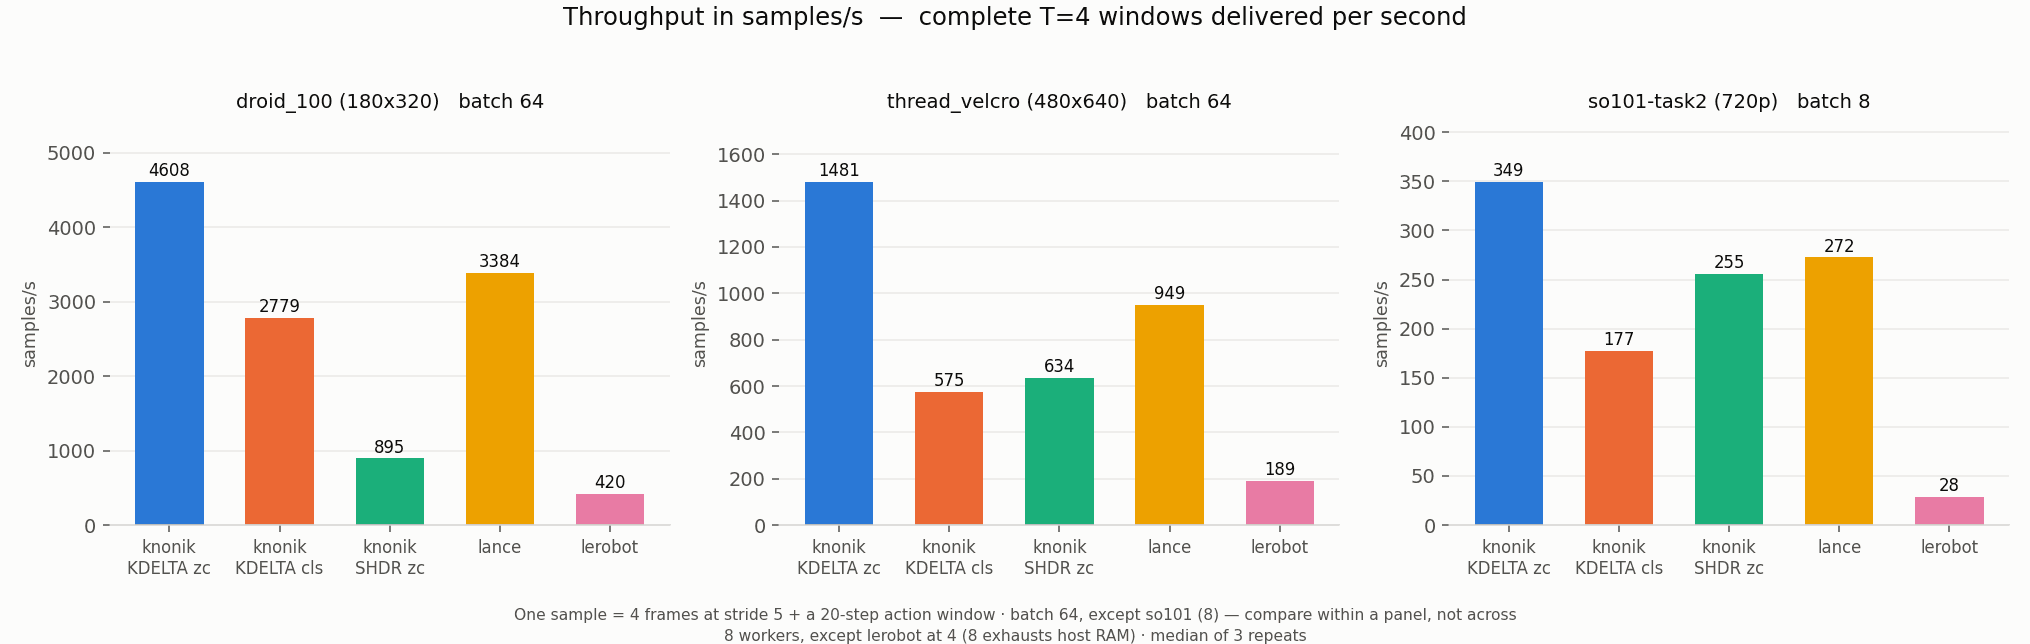
The same run counted in complete T=4 windows, which is the unit a training step actually consumes, rather than in frames. Batch 64 everywhere except so101-task2 at 8.
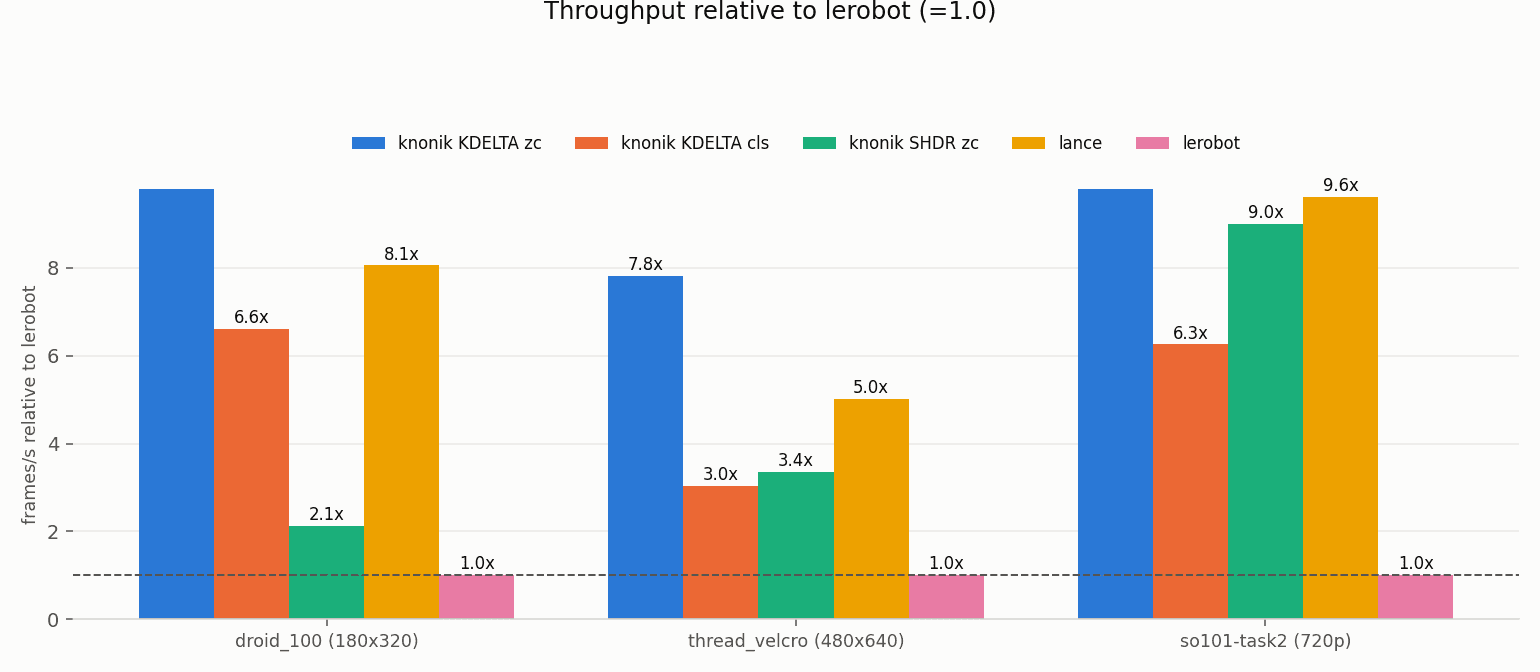
Every backend divided by the slowest common baseline, on a linear axis so bar length stays proportional to the value it encodes. knonik KDELTA zc runs off the top of the plotted range on droid_100 and so101-task2, at 11.0× and 12.3×.
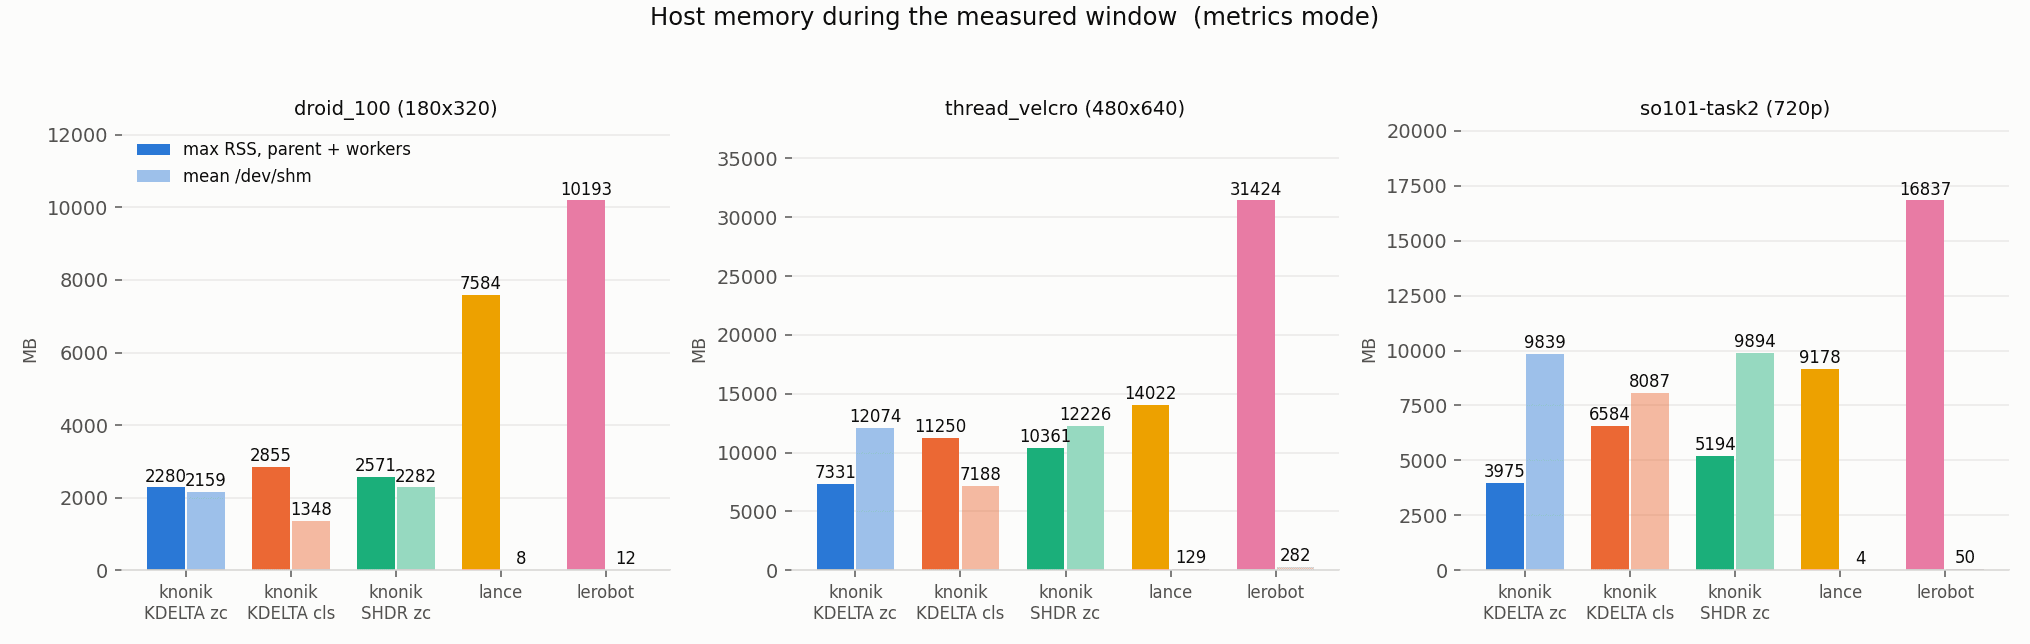
Saturated bar: maximum resident set of the parent process plus every descendant, sampled twice a second over the timed window. Pale bar: mean /dev/shm occupancy.
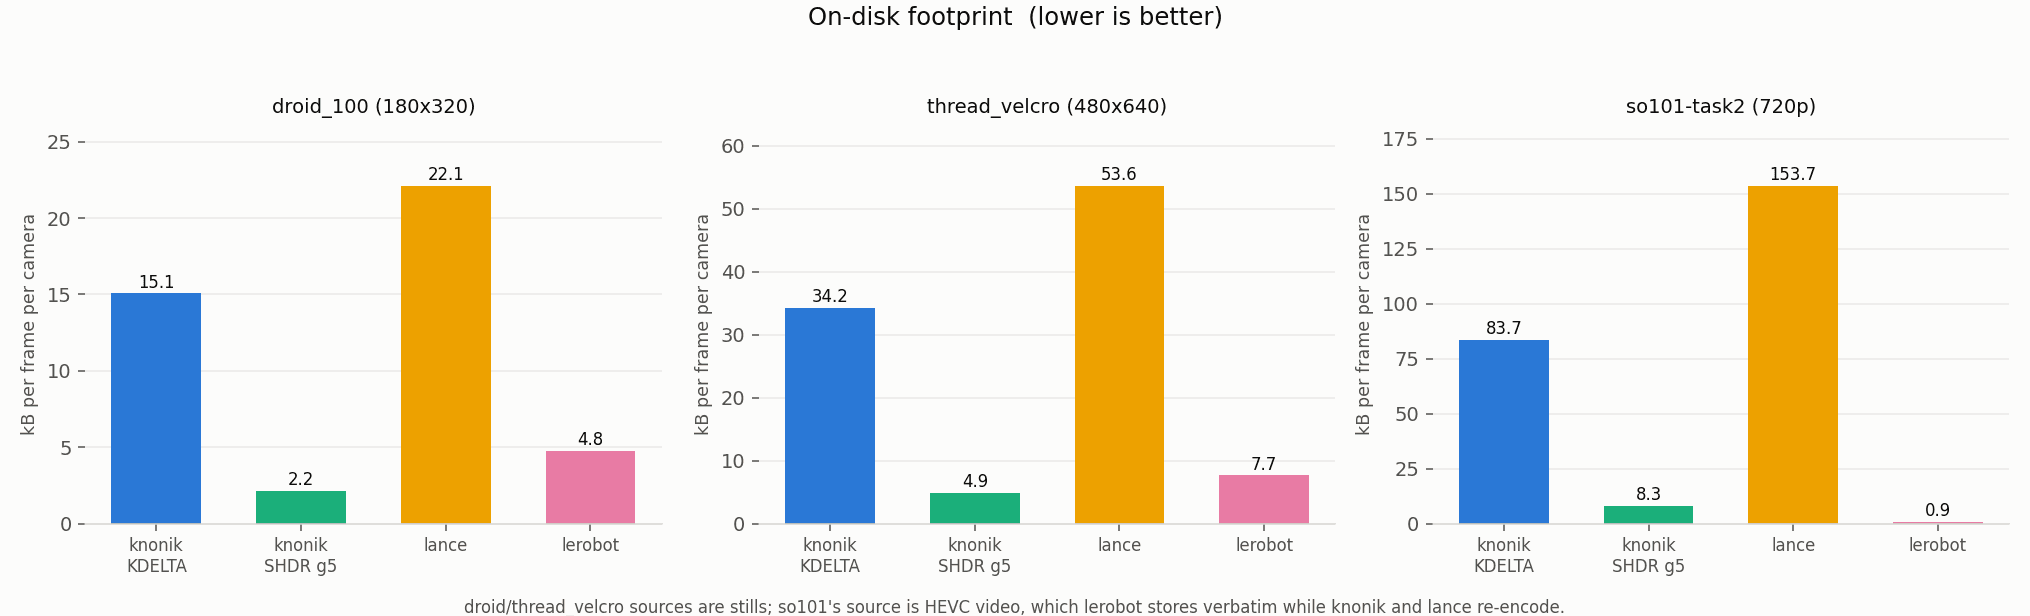
kB per frame per camera, so datasets with different frame counts and camera counts are directly comparable. Normalising by frames × cameras is what stops a dataset that stores three cameras from looking three times more expensive per frame than it is.
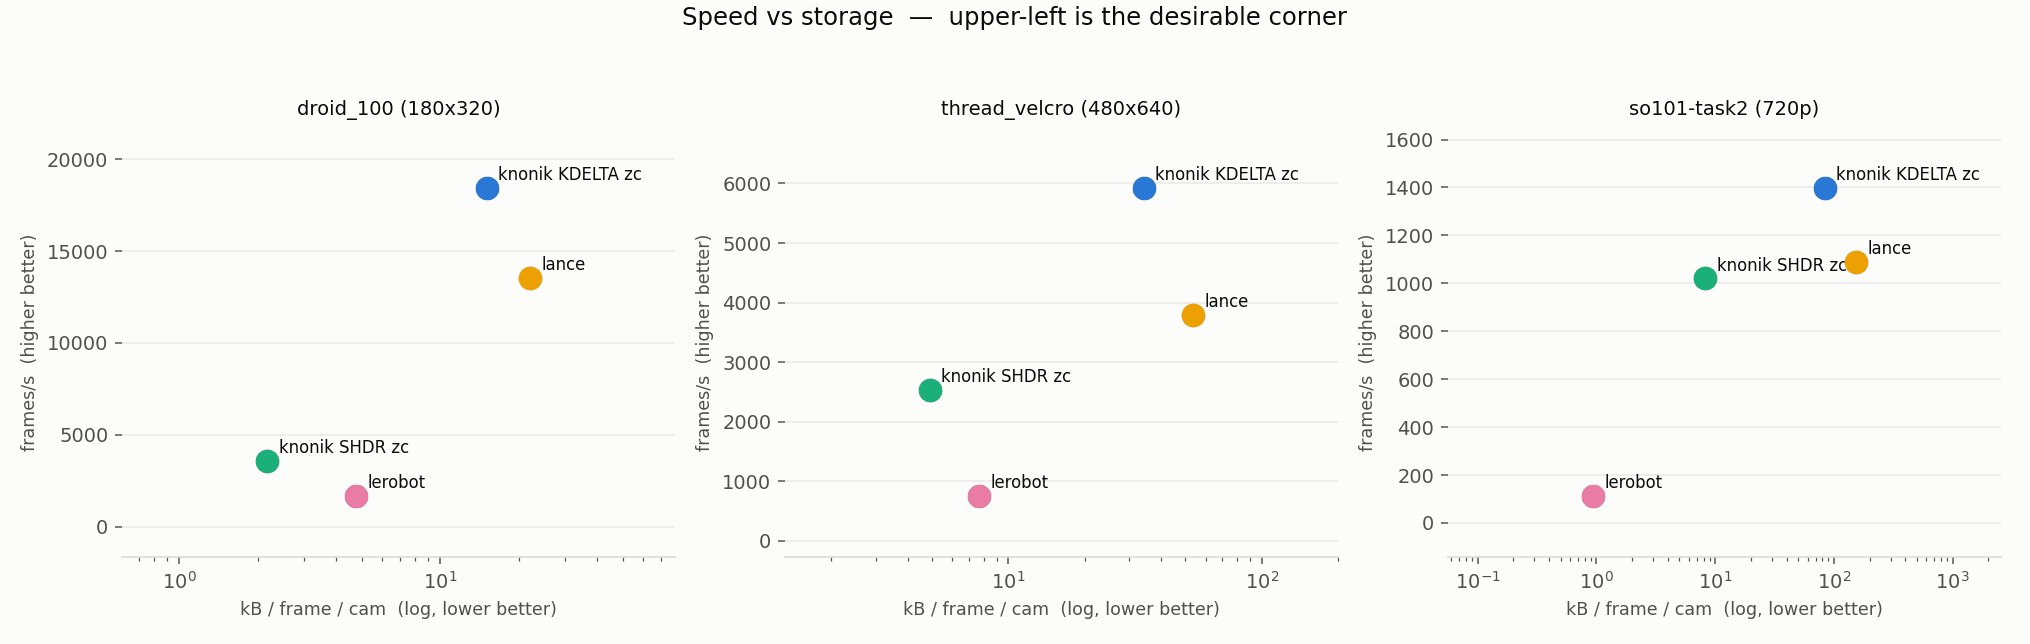
Throughput against bytes on disk, storage on a log axis. The upper-left corner is the desirable one. This is the figure that makes the KDELTA / SHDR choice concrete: SHDR moves left, KDELTA moves up, and both stay left of lance.
The same measurement with the memory sampler running and only one repeat. It is here to show the instrumentation cost: throughput drops by a few percent on every backend and the ordering does not change.
The metrics-mode counterpart of Fig 2.
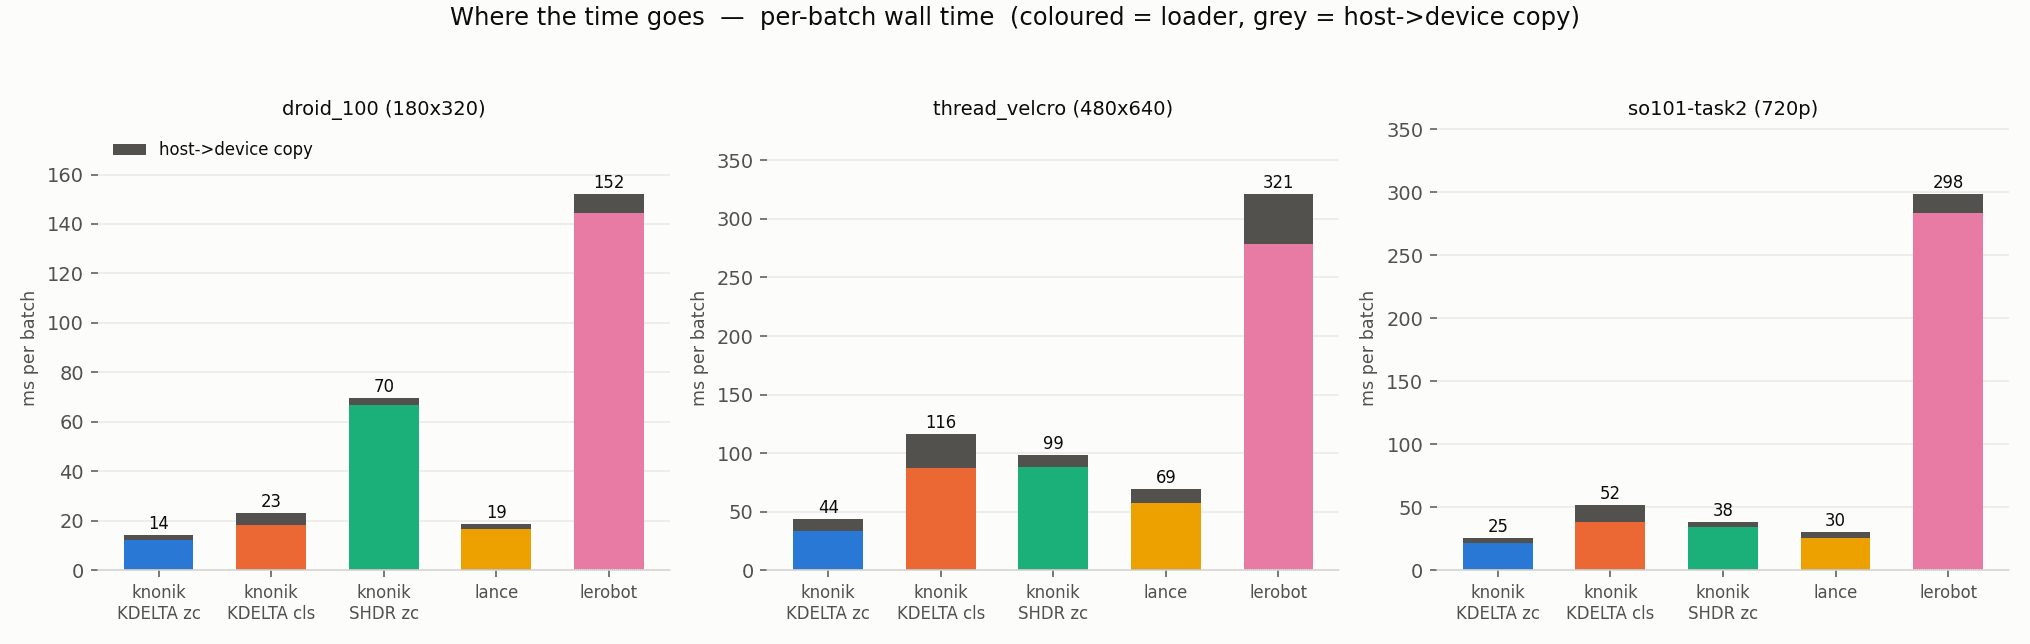
Each bar is one batch of wall time in metrics mode, split into the coloured loader segment and the grey host to device copy.
Every Measured Row (pure mode)
The complete contents of results/native_results.csv for pure mode: throughput, where the time goes inside a batch, bytes moved, dtype, and the spread across repeats.
| Dataset | Backend | Batch | Workers | samples/s | f/s loader | f/s e2e | MB/s | step ms | loader ms | H2D ms | H2D % | pix MB/batch | dtype | spread % |
|---|---|---|---|---|---|---|---|---|---|---|---|---|---|---|
| droid_100 (180×320) | knonik KDELTA zc | 64 | 8 | 4607.6 | 21,966 | 18,431 | 3,185 | 13.9 | 11.7 | 2.2 | 16 | 44.2 | uint8 | 4.9 |
| droid_100 (180×320) | knonik KDELTA cls | 64 | 8 | 2779.4 | 14,187 | 11,118 | 1,921 | 23.0 | 18.0 | 5.0 | 22 | 44.2 | uint8 | 11.8 |
| droid_100 (180×320) | knonik SHDR zc | 64 | 8 | 894.5 | 3,706 | 3,578 | 618 | 71.5 | 69.1 | 2.5 | 3 | 44.2 | uint8 | 4.5 |
| droid_100 (180×320) | lance | 64 | 8 | 3384.2 | 15,133 | 13,537 | 2,339 | 18.9 | 16.9 | 2.0 | 11 | 44.2 | uint8 | 3.3 |
| droid_100 (180×320) | lerobot | 64 | 4 | 420.1 | 1,767 | 1,680 | 1,161 | 152.4 | 144.9 | 7.5 | 5 | 176.9 | float32 | 3.3 |
| thread_velcro (480×640) | knonik KDELTA zc | 64 | 8 | 1480.7 | 7,756 | 5,923 | 5,459 | 43.2 | 33.0 | 10.2 | 24 | 235.9 | uint8 | 1.1 |
| thread_velcro (480×640) | knonik KDELTA cls | 64 | 8 | 574.7 | 3,152 | 2,299 | 2,119 | 111.4 | 81.2 | 30.1 | 27 | 235.9 | uint8 | 7.8 |
| thread_velcro (480×640) | knonik SHDR zc | 64 | 8 | 634.4 | 2,850 | 2,538 | 2,339 | 100.9 | 89.8 | 11.0 | 11 | 235.9 | uint8 | 1.6 |
| thread_velcro (480×640) | lance | 64 | 8 | 948.8 | 4,526 | 3,795 | 3,498 | 67.5 | 56.6 | 10.9 | 16 | 235.9 | uint8 | 6.8 |
| thread_velcro (480×640) | lerobot | 64 | 4 | 189.3 | 870 | 757 | 2,792 | 338.0 | 294.2 | 43.9 | 13 | 943.7 | float32 | 3.9 |
| so101-task2 (720p) | knonik KDELTA zc | 8 | 8 | 349.4 | 1,686 | 1,398 | 3,865 | 22.9 | 19.0 | 3.9 | 17 | 88.5 | uint8 | 8.9 |
| so101-task2 (720p) | knonik KDELTA cls | 8 | 8 | 177.4 | 970 | 709 | 1,962 | 45.1 | 33.0 | 12.1 | 27 | 88.5 | uint8 | 3.4 |
| so101-task2 (720p) | knonik SHDR zc | 8 | 8 | 255.3 | 1,169 | 1,021 | 2,823 | 31.3 | 27.4 | 4.0 | 13 | 88.5 | uint8 | 3.5 |
| so101-task2 (720p) | lance | 8 | 8 | 272.4 | 1,313 | 1,090 | 3,013 | 29.4 | 24.4 | 5.0 | 17 | 88.5 | uint8 | 10.6 |
| so101-task2 (720p) | lerobot | 8 | 4 | 28.4 | 120 | 113 | 1,254 | 282.2 | 267.3 | 14.9 | 5 | 353.9 | float32 | 2.7 |
H2D is the host to device copy: the time spent moving the decoded batch onto the GPU, and its share of the whole step.
frames/s in metrics mode
Single repeat, memory sampler running. Every backend loses a few percent; the ordering is unchanged.
| Backend | droid_100 (180×320) f/s | thread_velcro (480×640) f/s | so101-task2 (720p) f/s |
|---|---|---|---|
| knonik KDELTA zc | 17,793 | 5,857 | 1,259 |
| knonik KDELTA cls | 10,977 | 2,204 | 617 |
| knonik SHDR zc | 3,676 | 2,593 | 836 |
| lance | 13,774 | 3,700 | 1,057 |
| lerobot | 1,683 | 797 | 107 |
What Each Loader Costs in RAM
Sampled twice a second over the timed window across the parent process and every descendant. All columns in MB. Growth is the last fifth of the window minus the first fifth: a positive number means the loader was still accumulating memory when the measurement ended.
| Dataset | Backend | Max total RSS | Mean total RSS | Mean parent | Mean workers | /dev/shm | Procs | Growth |
|---|---|---|---|---|---|---|---|---|
| droid_100 (180×320) | knonik KDELTA zc | 2,280 | 1,963 | 1,481 | 481 | 2,159 | 9 | +1593 |
| droid_100 (180×320) | knonik KDELTA cls | 2,855 | 2,572 | 1,707 | 866 | 1,348 | 5 | +713 |
| droid_100 (180×320) | knonik SHDR zc | 2,571 | 2,481 | 2,007 | 474 | 2,282 | 9 | +185 |
| droid_100 (180×320) | lance | 7,584 | 4,972 | 1,416 | 3,556 | 8 | 9 | +5711 |
| droid_100 (180×320) | lerobot | 10,193 | 9,239 | 4,997 | 4,242 | 12 | 5 | +1558 |
| thread_velcro (480×640) | knonik KDELTA zc | 7,331 | 6,253 | 5,204 | 1,049 | 12,074 | 9 | +4217 |
| thread_velcro (480×640) | knonik KDELTA cls | 11,250 | 9,977 | 5,995 | 3,982 | 7,188 | 5 | +3673 |
| thread_velcro (480×640) | knonik SHDR zc | 10,361 | 10,005 | 9,475 | 530 | 12,226 | 9 | +1411 |
| thread_velcro (480×640) | lance | 14,022 | 10,325 | 4,851 | 5,474 | 129 | 9 | +8148 |
| thread_velcro (480×640) | lerobot | 31,424 | 27,850 | 19,740 | 8,111 | 282 | 5 | +6021 |
| so101-task2 (720p) | knonik KDELTA zc | 3,975 | 3,349 | 2,358 | 991 | 9,839 | 9 | +1639 |
| so101-task2 (720p) | knonik KDELTA cls | 6,584 | 5,540 | 3,037 | 2,502 | 8,087 | 5 | +2215 |
| so101-task2 (720p) | knonik SHDR zc | 5,194 | 4,176 | 3,501 | 675 | 9,894 | 9 | +254 |
| so101-task2 (720p) | lance | 9,178 | 5,924 | 1,880 | 4,044 | 4 | 9 | +6683 |
| so101-task2 (720p) | lerobot | 16,837 | 15,142 | 10,926 | 4,215 | 50 | 5 | +2823 |
Peak memory of the parent process alone is deliberately not published: it is a process-lifetime high-water mark, so a backend measured later in the same process would inherit the peaks of the ones before it. Everything above comes from the sampler instead. Note also that knonik's /dev/shm figures are shared, file-backed and reclaimable memory, which is a materially different cost from anonymous per-worker memory.
On-Disk Footprint
Apparent size of each dataset directory, normalised by frames × cameras so the three datasets are comparable. knonik and lance figures include the numeric columns; lerobot is the whole dataset directory.
| Dataset | Format | Total on disk | B / frame / cam | kB / frame / cam | vs lance |
|---|---|---|---|---|---|
| droid_100 (180×320) | knonik KDELTA | 1.49 GB | 15,434 | 15.1 | 1.5× smaller |
| droid_100 (180×320) | knonik SHDR g5 | 0.21 GB | 2,219 | 2.2 | 10.2× smaller |
| droid_100 (180×320) | lance | 2.19 GB | 22,637 | 22.1 | 1.0× |
| droid_100 (180×320) | lerobot | 0.47 GB | 4,871 | 4.8 | 4.6× smaller |
| thread_velcro (480×640) | knonik KDELTA | 1.20 GB | 35,046 | 34.2 | 1.6× smaller |
| thread_velcro (480×640) | knonik SHDR g5 | 0.17 GB | 5,007 | 4.9 | 11.0× smaller |
| thread_velcro (480×640) | lance | 1.88 GB | 54,895 | 53.6 | 1.0× |
| thread_velcro (480×640) | lerobot | 0.27 GB | 7,853 | 7.7 | 7.0× smaller |
| so101-task2 (720p) | knonik KDELTA | 2.90 GB | 85,702 | 83.7 | 1.8× smaller |
| so101-task2 (720p) | knonik SHDR g5 | 0.29 GB | 8,477 | 8.3 | 18.6× smaller |
| so101-task2 (720p) | lance | 5.32 GB | 157,358 | 153.7 | 1.0× |
| so101-task2 (720p) | lerobot | 0.03 GB | 955 | 0.9 | 164.8× smaller * |
* so101-task2 ships as HEVC video, which LeRobot stores as-is while knonik and lance both re-encode. That row compares codecs rather than containers.
Run It Yourself
The harness is MIT-licensed, standalone, and public. It runs in whatever environment you activate, it detects the datasets it finds on disk, and a backend that does not import is reported as unavailable rather than quietly dropped from a chart. The repository has the install steps, the conversion scripts for each dataset, and every command used to produce the numbers on this page.